A while back the Lab produced the only positive result in my entire trading stack. A dead-simple
trend filter — hold the coin while it's above its 50-day moving average, sit in cash otherwise —
returned +62.8% mean across coins, against +8% for buy & hold. I wrote it down as "the most
promising lead" and moved on.
This week I went back and tested it properly. Here's what was wrong with that number, and what
survived.
Four things the original test didn't do
It charged no fees, despite flipping position about 60 times per coin. It had no
out-of-sample split — one backtest over the full history, with the window chosen after seeing
the answer. It tried only two windows, 50 and 200. And it had no null control, so nothing
established the method couldn't find "edge" in data with no trend at all.
That last one matters more than it sounds. If your method finds signal in random noise, every
result it ever produced is worthless.
Fees first
Charging Kraken's 0.26% on every flip costs about 25 percentage points. MA50 still came out at
+51.5%. So the original number wasn't fabricated — trading costs alone didn't kill it.
What killed it was asking whether I could have known to pick MA50 in advance.
The real test
Sliding walk-forward: pick the moving-average window using one year of history, then trade it
blind on the next 90 days. Roll forward. 14 coins with enough history, 104 folds, fees on every
position change, 14 candidate windows from 10 to 300 days.
Two results came out of it, and the second one is the one I'd actually tell you about.
Result one: it's insurance, not alpha
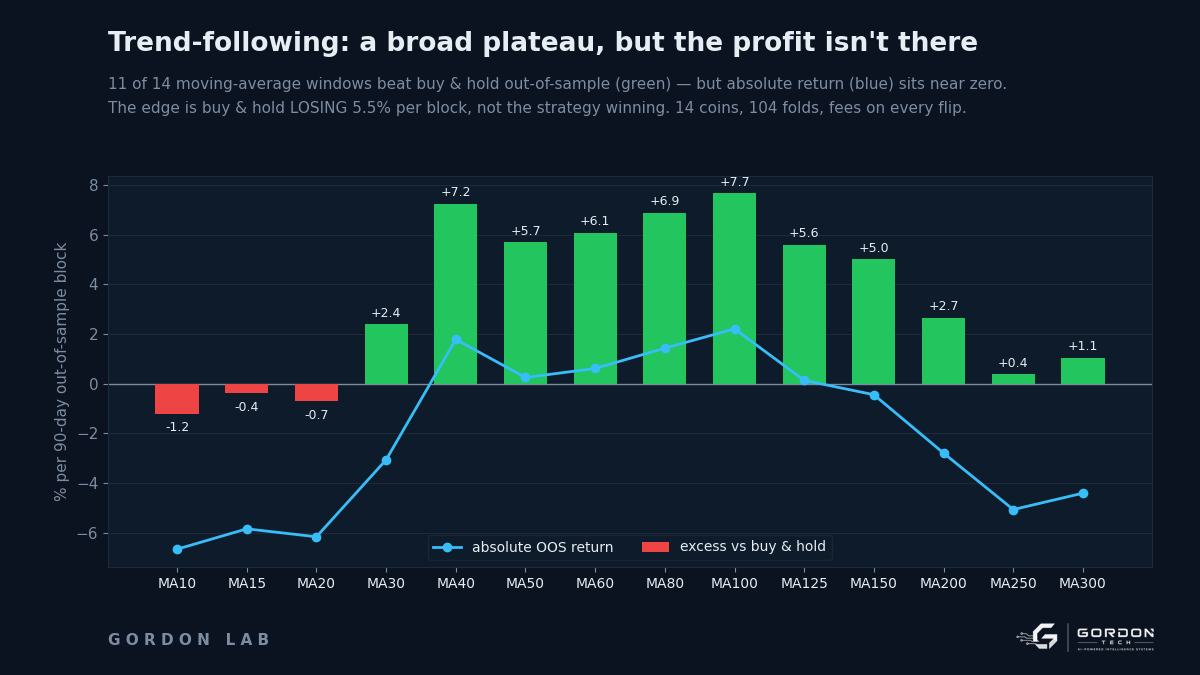
Fixing a window and never optimising it, 11 of 14 windows beat buy & hold out-of-sample. That's
a broad plateau rather than one lucky setting, which is usually the signature of something real.
MA40 beat buy & hold by 7.25 points per 90-day block, MA100 by 7.67.
But look at the absolute number: the whole MA30–150 band returned +0.37% per 90-day block.
Buy & hold returned −5.46%.
The edge is almost entirely buy & hold losing, not the strategy winning. Only 21–38% of
individual 90-day blocks were profitable at all. What it actually does is sit out the worst
stretches: max drawdown at MA40 was −57.8% against buy & hold's −82.0%, with 86% of coins
finishing positive versus 43%.
That's a real, useful property. It is not the thing "+62.8%" made it sound like. It's insurance,
and insurance has a premium.
Result two: optimising it made it worse
This is the part I didn't expect.
Picking the best-performing window from in-sample history returned −0.56% per 90-day block —
worse than simply fixing MA100 and never touching it (+2.21%). The in-sample-to-out-of-sample
decay ratio was −0.01: the sign flipped. The chosen window scattered across the entire 10–300
grid from fold to fold.
The parameter selection carried no information forward whatsoever. Every hour spent tuning it was
worse than useless — it actively transferred money from the strategy to the exchange.
If I ever run this, the rule is: pick something in the middle of the plateau and never tune it
again.
The null control
On shuffled returns — same distribution, trend structure destroyed — the filter scored −6.86
points against buy & hold, versus +4.90 on real data. So it only helps where trend and volatility
clustering genuinely exist. The mechanism is coherent, which is reassuring.
I also checked the harness against a synthetic trending series (found the edge), a random walk
(correctly found nothing), and a deliberate lookahead probe where cheating scored strictly better
than the honest path — confirming no leak.
What I'm not going to pretend
This is one falling three-year crypto market. A trend filter is expected to lag buy & hold
in a sustained rally, through whipsaws and late entries. This result does not generalise to an
up-regime, and I have not tested one. The 14 coins are also heavily correlated to Bitcoin, so 104
folds are nowhere near 104 independent bets.
Nothing here is wired to anything live. No money moved.
Why publish a result this deflating
Because the alternative was leaving "+62.8%, most promising lead" in my notes and slowly building
on top of it. The number was real. The conclusion drawn from it wasn't.
The finding I'll actually carry forward isn't about moving averages at all. It's that the tuning
step — the part that feels like the work — was the part making it worse.