Auto-generated by Gordon Lab from a real backtest — published as a draft for review, not live.
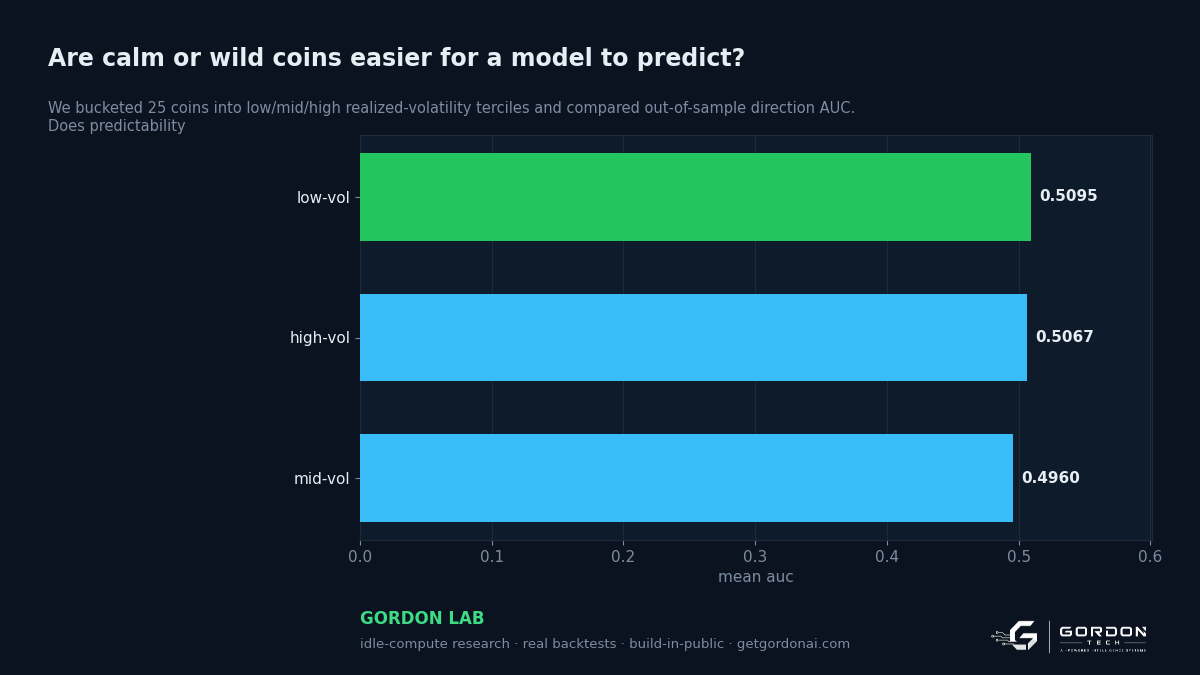
The question: We bucketed 25 coins into low/mid/high realized-volatility terciles and compared out-of-sample direction AUC. Does predictability live in the calm names or the wild ones?
What the data said
'low-vol' leads on mean_auc: +0.509
- Range across 3 groups: +0.509 (best low-vol) down to +0.496 — read the table for the full, unvarnished spread.
Full results
| group | metric |
|---|---|
| low-vol | 0.5095 |
| high-vol | 0.5067 |
| mid-vol | 0.496 |
Generated by Gordon Lab from a real backtest. Method + caveats live in the harness; this is research, not advice — and the losing runs are shown too.